sudori part 8: no-op compilation performance
This is a blog post on sbt 2.x development, continuing from sbt 2.x remote cache, sudori part 4, part 5 etc. I work on sbt 2.x in my own time with collaboration with the Scala Center and other volunteers, like Billy at EngFlow. In this post, I want to highlight the perf improvement work I attempted in sbt 2.0.0-RC7, which was released yesterday.
no-op performance regression
Besides jump starting the plugin ecosystem, one of the motivations for the having release candidates of sbt 2.x is to start testing them with actual builds. As they say, everybody has an operational plan until they get punched in the mouth.
One issue that caught my attention was [2.x] perf: Regression of no-op compilation #8360 reported by Matt Dziuban:
My build at work contains 28 projects, which is likely larger than most builds, but a lot smaller than the 84 projects in lila etc.
I found that with sbt 1.11.7 in a fully compiled state (i.e. after I ran
clean; Test/compile), if I runTest/compile5 times in a row, the timings reported are:
[success] Total time: 3 s, completed Oct 24, 2025, 1:31:01 PM
[success] Total time: 2 s, completed Oct 24, 2025, 1:31:03 PM
[success] Total time: 1 s, completed Oct 24, 2025, 1:31:04 PM
[success] Total time: 1 s, completed Oct 24, 2025, 1:31:05 PM
[success] Total time: 1 s, completed Oct 24, 2025, 1:31:05 PM
With sbt 2.0.0-RC6, the same test showed much worse performance:
[success] elapsed time: 19 s, cache 99%, 961 disk cache hits, 9 onsite tasks
[success] elapsed time: 17 s, cache 99%, 964 disk cache hits, 6 onsite tasks
[success] elapsed time: 14 s, cache 99%, 964 disk cache hits, 6 onsite tasks
[success] elapsed time: 14 s, cache 99%, 964 disk cache hits, 6 onsite tasks
[success] elapsed time: 13 s, cache 99%, 964 disk cache hits, 6 onsite tasks
local reproduction
Before starting actual coding, I wanted to reproduce this behavior in my own machine. I then remembered either someone using sttp’s build for testing or saying it has a large number of subprojects. When I checked it out it had 206 subprojects, and relatively few plugins.
After some time, I was able to comment out Scala.JS and Scala Native plugins, and get it to build on multiple Scala versions, totaling 107 subprojects. Not quite as bad as Matt’s build, but I was able to reproduce slow no-op compilation:
sbt:sttp> Test/compile
[success] elapsed time: 19 s, cache 100%, 3076 disk cache hits
sbt:sttp> Test/compile
[success] elapsed time: 8 s, cache 100%, 3076 disk cache hits
sbt:sttp> Test/compile
[success] elapsed time: 8 s, cache 100%, 3076 disk cache hits
sbt:sttp> Test/compile
[success] elapsed time: 8 s, cache 100%, 3076 disk cache hits
sbt:sttp> Test/compile
[success] elapsed time: 7 s, cache 100%, 3076 disk cache hits
sbt:sttp> Test/compile
[success] elapsed time: 7 s, cache 100%, 3076 disk cache hits
sbt:sttp> Test/compile
[success] elapsed time: 8 s, cache 100%, 3076 disk cache hits
The same 107 subprojects no-op Test/compile converges to 4±1s on sbt 1.x on my macOS laptop.
- Note: These numbers should be considered just a guideline to aid development, running on an M2 macOS laptop, and might vary depending on the operating system etc. More accurate micro benchmarking can be performed using JMH using GitHub Action etc.
hot spot identification
While most source code would translate to a machine code for JVM and eventually to machine code, the running execution of the program will spend majority of the time in a small portion of the code, especially during some specific operation. The small portion of the code is called a hot spot, or a bottleneck if it impedes the overall speed of the program.
On JVM, async-profiler works well by collecting profiling information, and exporting it as flamegraph. From one tab, I run Test/compile 10 times after a few warmup runs:
# Start sbt shell
$ sbt

# Warmup 1
> Test/compile

# Warmup 2
> Test/compile

# Test
>Test/compile; Test/compile; Test/compile; Test/compile; Test/compile; Test/compile; Test/compile; Test/compile; Test/compile; Test/compile; Test/compile;
Once it’s running Test/compile repeatedly, run the following from the second tab:
asprof -d 60 -f rc6.jfr sbt-launch.jar
jfrconv --lines rc6.jfr rc6.html
- Note: The above assumes no other sbt sessions are running on the machine. Otherwise pass in a process id.
asprofcan directly generate flamegraph using-f out.html, but it does not include the line numbers, which is an essential information for Scala since many of the function names are synthetic.
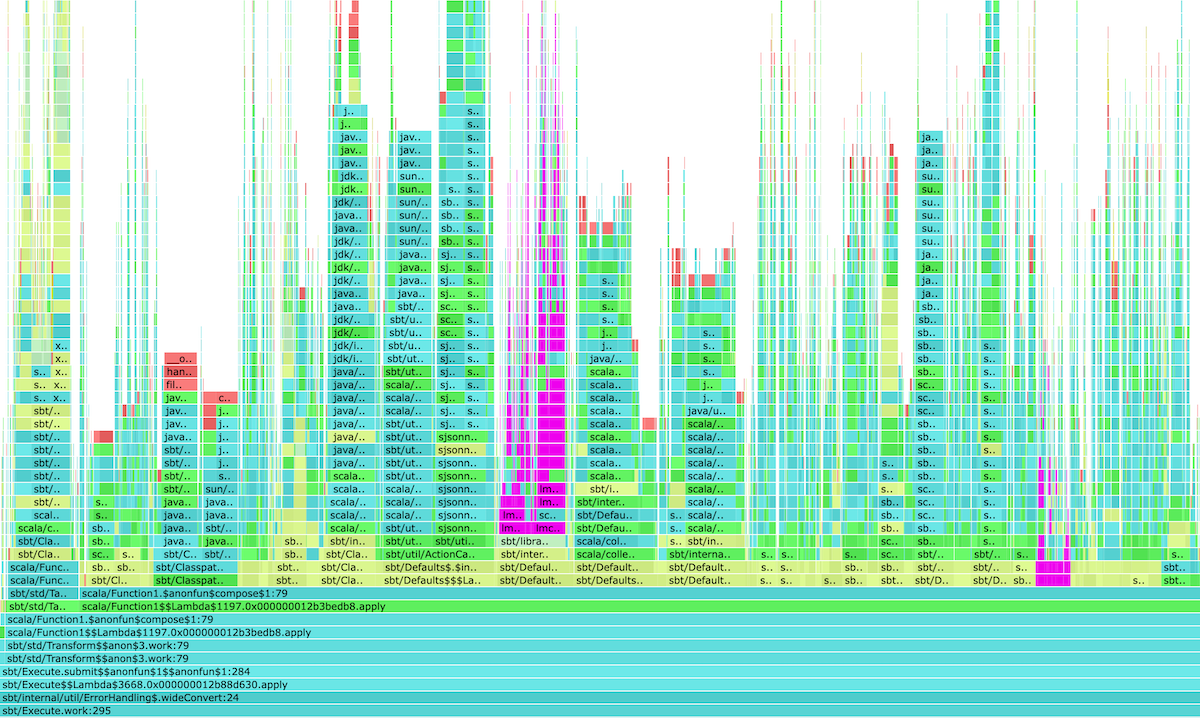
rc6.html is available on Gist. The following is sbt.Execute#work portion of the flamegraph:
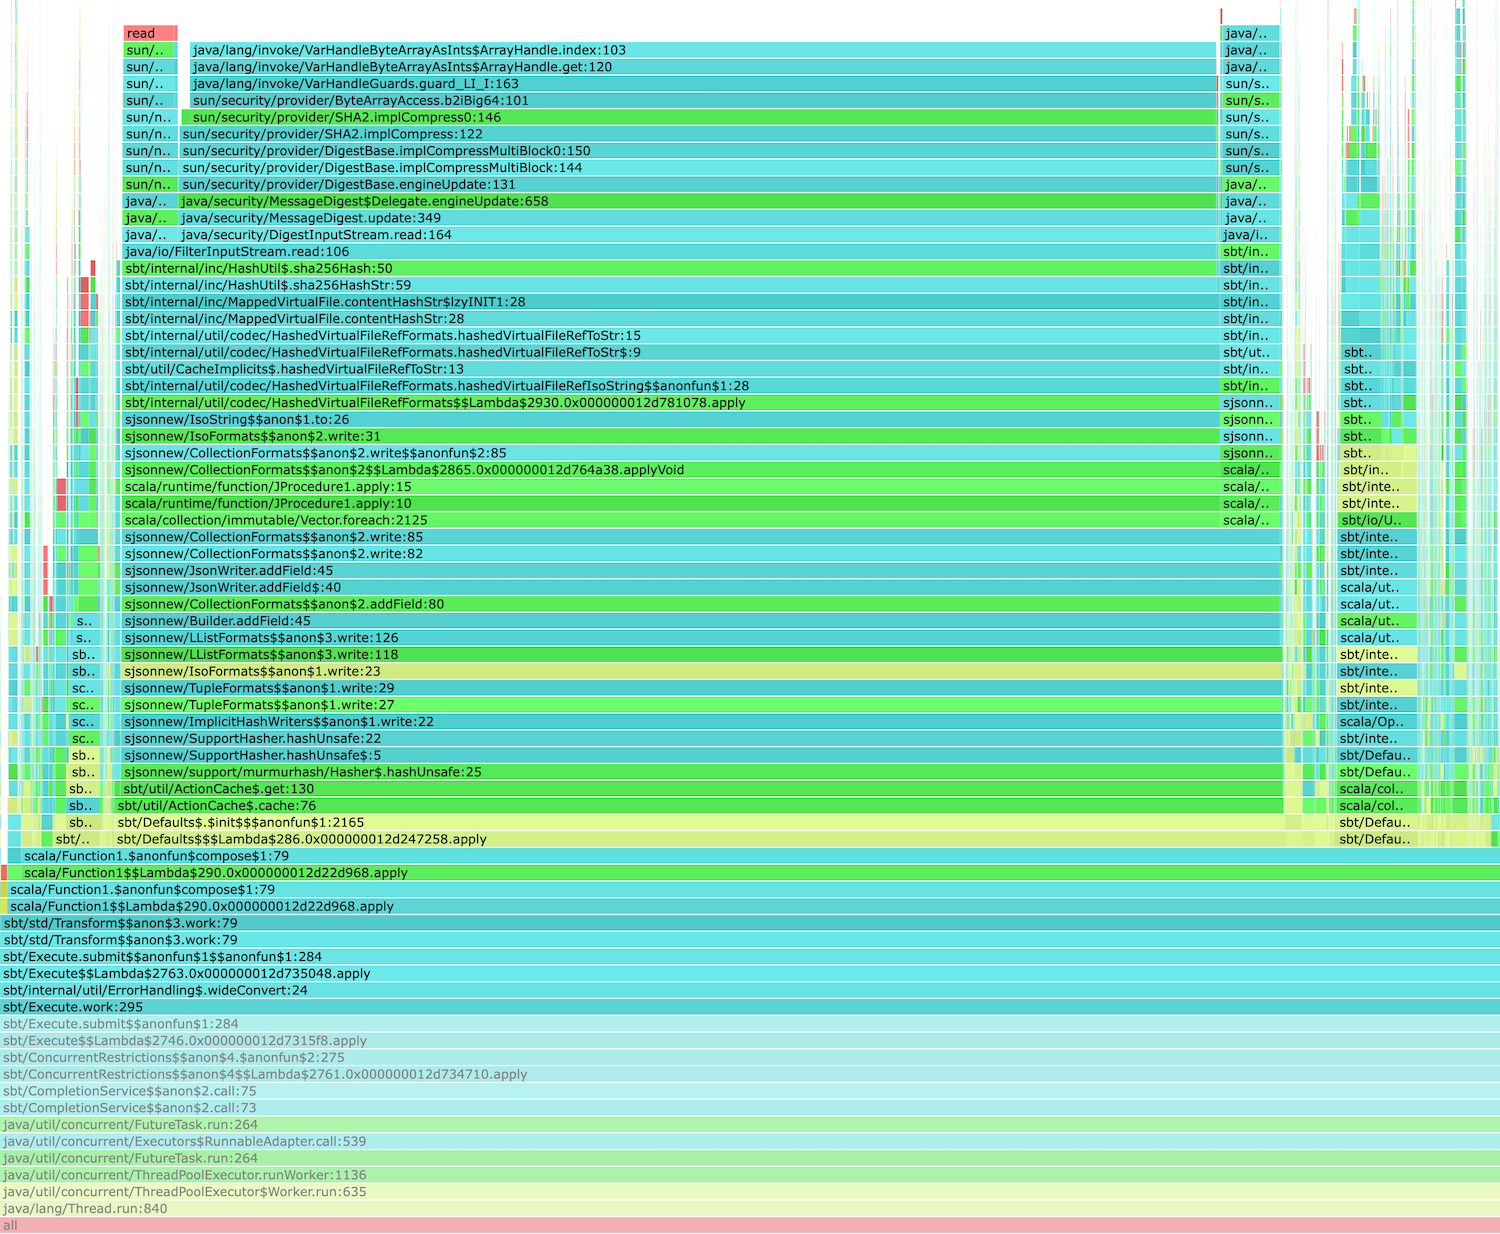
This shows that during the no-op Test/compile, around 70% of the work code is spent on sbt.internal.inc.HashUtil.sha256Hash. This is not great, but given the cache related changed introduced in sbt 2.x, SHA256 being the hot spot is not a total surprise.
speeding up the hash
There are probably two routes to speed up SHA256 digest. First is to cache the digest based on some other information such as the file size and the timestamp. Second is to use faster digest algorithm.
To improve the no-op performance, likely the first route is more effective. I sent perf: Cache content hash of binary files #8363, which caches sha256 digest in a Caffeine cache using the file name, file size, and the timestamp as key. Since this is an in-memory cache, it should be safe to use the timestamp information.
- Note: Caching the digest poses an interesting question: how large should this digest cache be? For the particular setup that I tested, 1MB seemed to be the sweet spot. This will be configurable with
Global / localDigestCacheByteSizesetting.
Caching sha256 values halved the no-op Test/compile time from 8±1s to 4±1s. We can also confirm this by running profiling again, and checking the flamegraph:
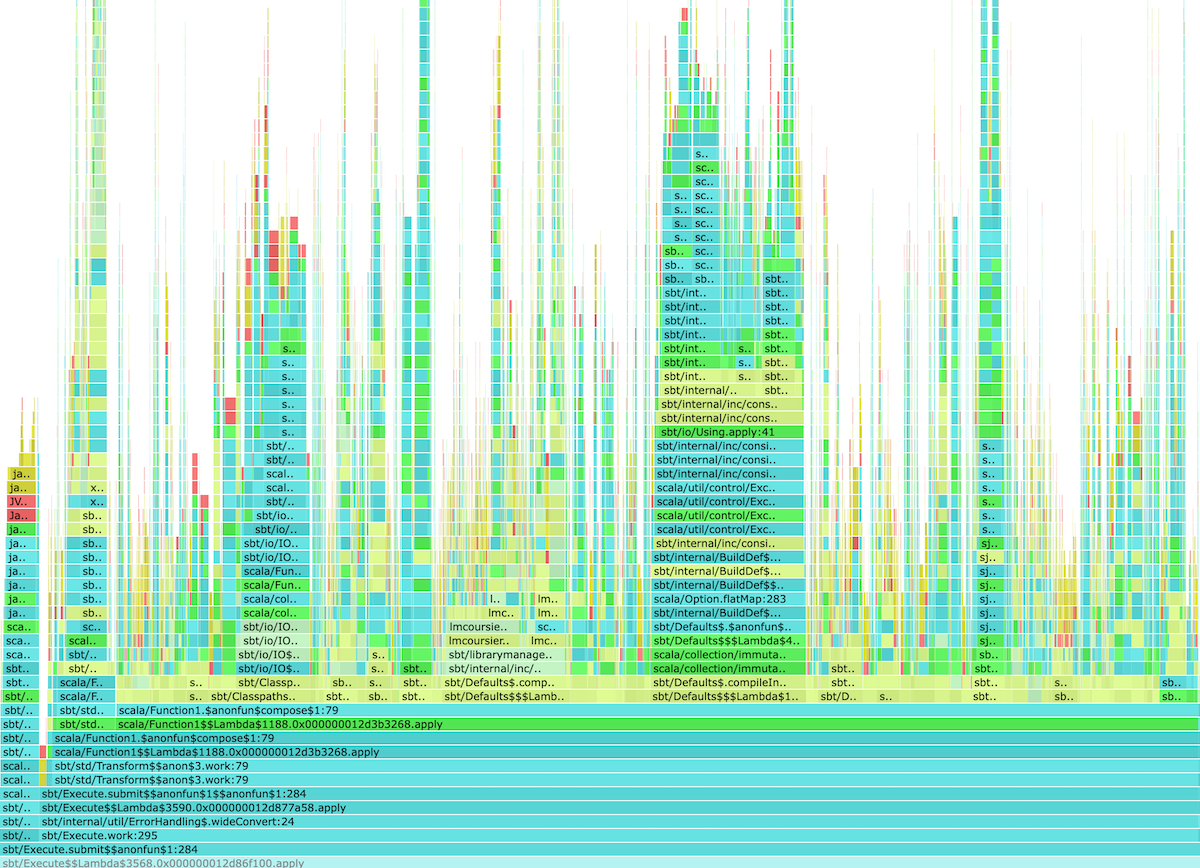
This shows that sha256 is no longer the prevailing hot spot.
speeding up Analysis parsing
The next hot spot became the Analysis parsing. Analysis file contains the results of incremental compilation, and the previous analysis is passed into the next round of incremental compilation. This is normally stored in a Protobuf file.
To speed this up, I sent [2.x] perf: Cache Zinc Analysis across compilations. This take almost the same strategy as sha256 digest caching, except this time I’m caching the Analysis. This improved no-op compilation from 4±1s to 3±1s.
avoiding directory copying
Here’s the flamegraph post-Protobuf caching:
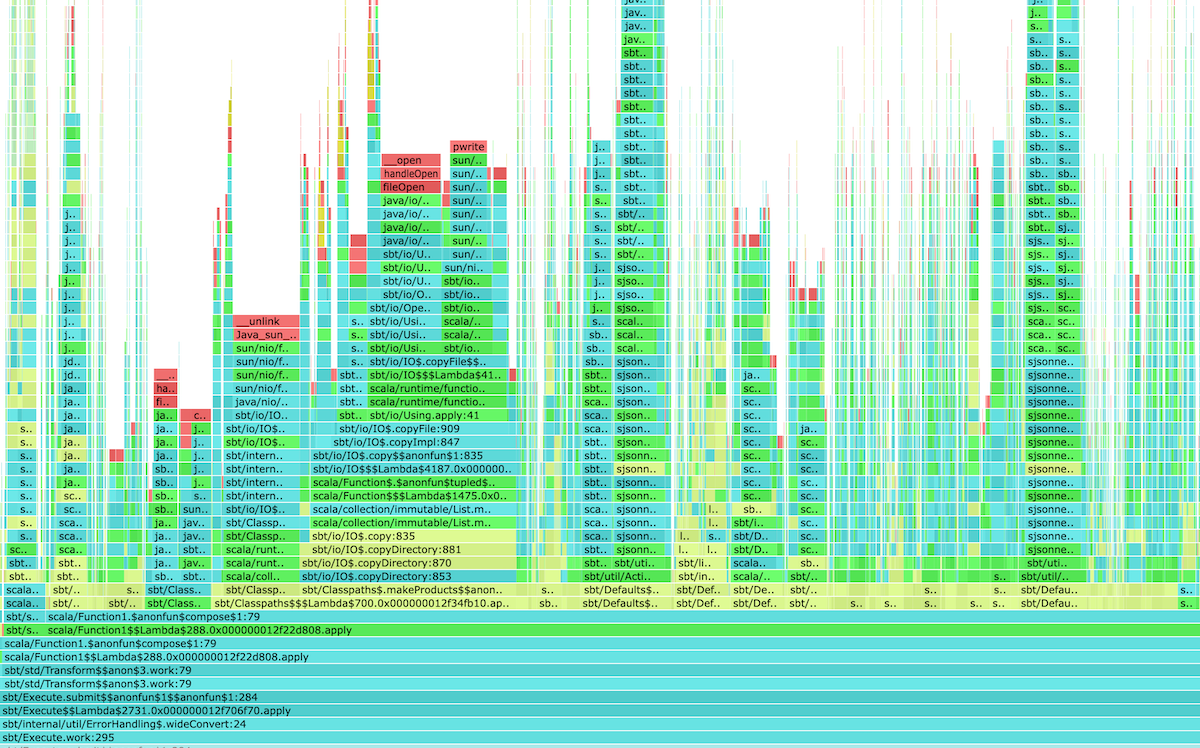
The flamegraph shows that the next hot spot became sbt.io.copyDirectory(...). This is an interesting one.
- On sbt 1.x, sbt creates a single directory called
classes/that the downstream subproject or test can use as a classpath. This means that the compiler generates*.classfiles intoclasses/and later onsrc/main/resources/are copied into the directory. - Since sbt 2.x tries to make the result of the compilation cachable, we let the compiler generate the
*.classfiles elsewhere and copy them intoclasses/.
Depending on the size of the classes and the operating system, having to copy both *.class files and resources can be expensive. To speed this up, I sent [2.x] perf: Avoid copying directories #8374. This improved no-op compilation from 3±1s to 2±1s on macOS. Likely on Windows, we would have further speedup.
speeding up dependency resolution
Here’s the flamegraph after avoiding directory copying:
At some point Jason Zaugg took a look at one of the flamegraphs. The first things he noticed was that Coursier dependency resolution is showing up, which he thought was odd. Looking at the stack trace, it’s coming from Defaults.scala:730:
scalaCompilerBridgeBinaryJar := Def.uncached {
  val sv = scalaVersion.value
  val managed = managedScalaInstance.value
  val hasSbtBridge = ScalaArtifacts.isScala3(sv) || ZincLmUtil.hasScala2SbtBridge(sv)
  if hasSbtBridge && managed then
    val jar = ZincLmUtil.fetchDefaultBridgeModule(
      sv,
      dependencyResolution.value,
      updateConfiguration.value,
      (update / unresolvedWarningConfiguration).value,
      streams.value.log
    )
    Some(jar)
  else None
},
This is the code that is calling Coursier, but specifically for the binary compiler bridge, which is used for Scala 3.x and modern Scala 2.13.x. Coursier itself has its own disk cache, but we can likely squeeze some performance by skipping to call IO work related to the resolution. I sent [2.x] perf: Cache compiler bridge binary, which uses a Selective functor and the sbt 2.x cache to cache the prebuild compiler bridge binary:
scalaCompilerBridgeBin := Def
  .ifS(Def.task {
    val sv = scalaVersion.value
    val managed = managedScalaInstance.value
    val hasSbtBridge = ScalaArtifacts.isScala3(sv) || ZincLmUtil.hasScala2SbtBridge(sv)
    hasSbtBridge && managed
  })(Def.cachedTask {
    val sv = scalaVersion.value
    ....
    IO.copyFile(jar, out)
    Def.declareOutput(outVf)
    Vector(outVf: HashedVirtualFileRef)
  })(Def.task(Vector.empty))
  .value,
Here’s how it looks on the sttp build:
sbt:sttp> Test/compile
[success] elapsed time: 13 s, cache 100%, 2877 disk cache hits
sbt:sttp> Test/compile
[success] elapsed time: 4 s, cache 100%, 2877 disk cache hits
sbt:sttp> Test/compile
[success] elapsed time: 2 s, cache 100%, 2877 disk cache hits
sbt:sttp> Test/compile
[success] elapsed time: 2 s, cache 100%, 2877 disk cache hits
sbt:sttp> Test/compile
[success] elapsed time: 2 s, cache 100%, 2877 disk cache hits
sbt:sttp> Test/compile
[success] elapsed time: 2 s, cache 100%, 2877 disk cache hits
sbt:sttp> Test/compile
[success] elapsed time: 2 s, cache 100%, 2877 disk cache hits
This improved no-op compilation from 2±1s to 2±0s. Since the flamegraph has many towers, avoiding to call Coursier alone probably saves something in the order of hundred milliseconds, not seconds.
summary
We are using RC builds of sbt 2.0 to identify critical bugs. One of the identified issues in RC-6 was [2.x] perf: Regression of no-op compilation #8360 reported by Matt Dziuban. For sbt 2.0.0-RC7 I sent a series of pull requests to to bring down no-op Test/compile of 107 subprojects from 8±1s to 2±0s, and also avoid some of the directory copying operations, which likely will speed up builds on Windows with large files.
Based on his initial report, I first created a local reproduction by porting sttp’s build to sbt 2.x, which contains 107 subproject after commenting out JS and Native subprojects. This is by no means perfect, but having a local reproduction allowed me to test changes quickly.
The workflow consisted of running Test/compile repeatedly, and attaching async-profiler to the JVM process, exporting the result to a flamegraph, then visually identify the hot spot. Once a hot spot is identified, we can try different strategy to speedup the call, typically by caching somehow to avoid expensive CPU or IO-bound functions. For example, by caching SHA256 calls using the file name, file size, and the timestamp, we were able to double the speed from 8±1s to 4±1s.
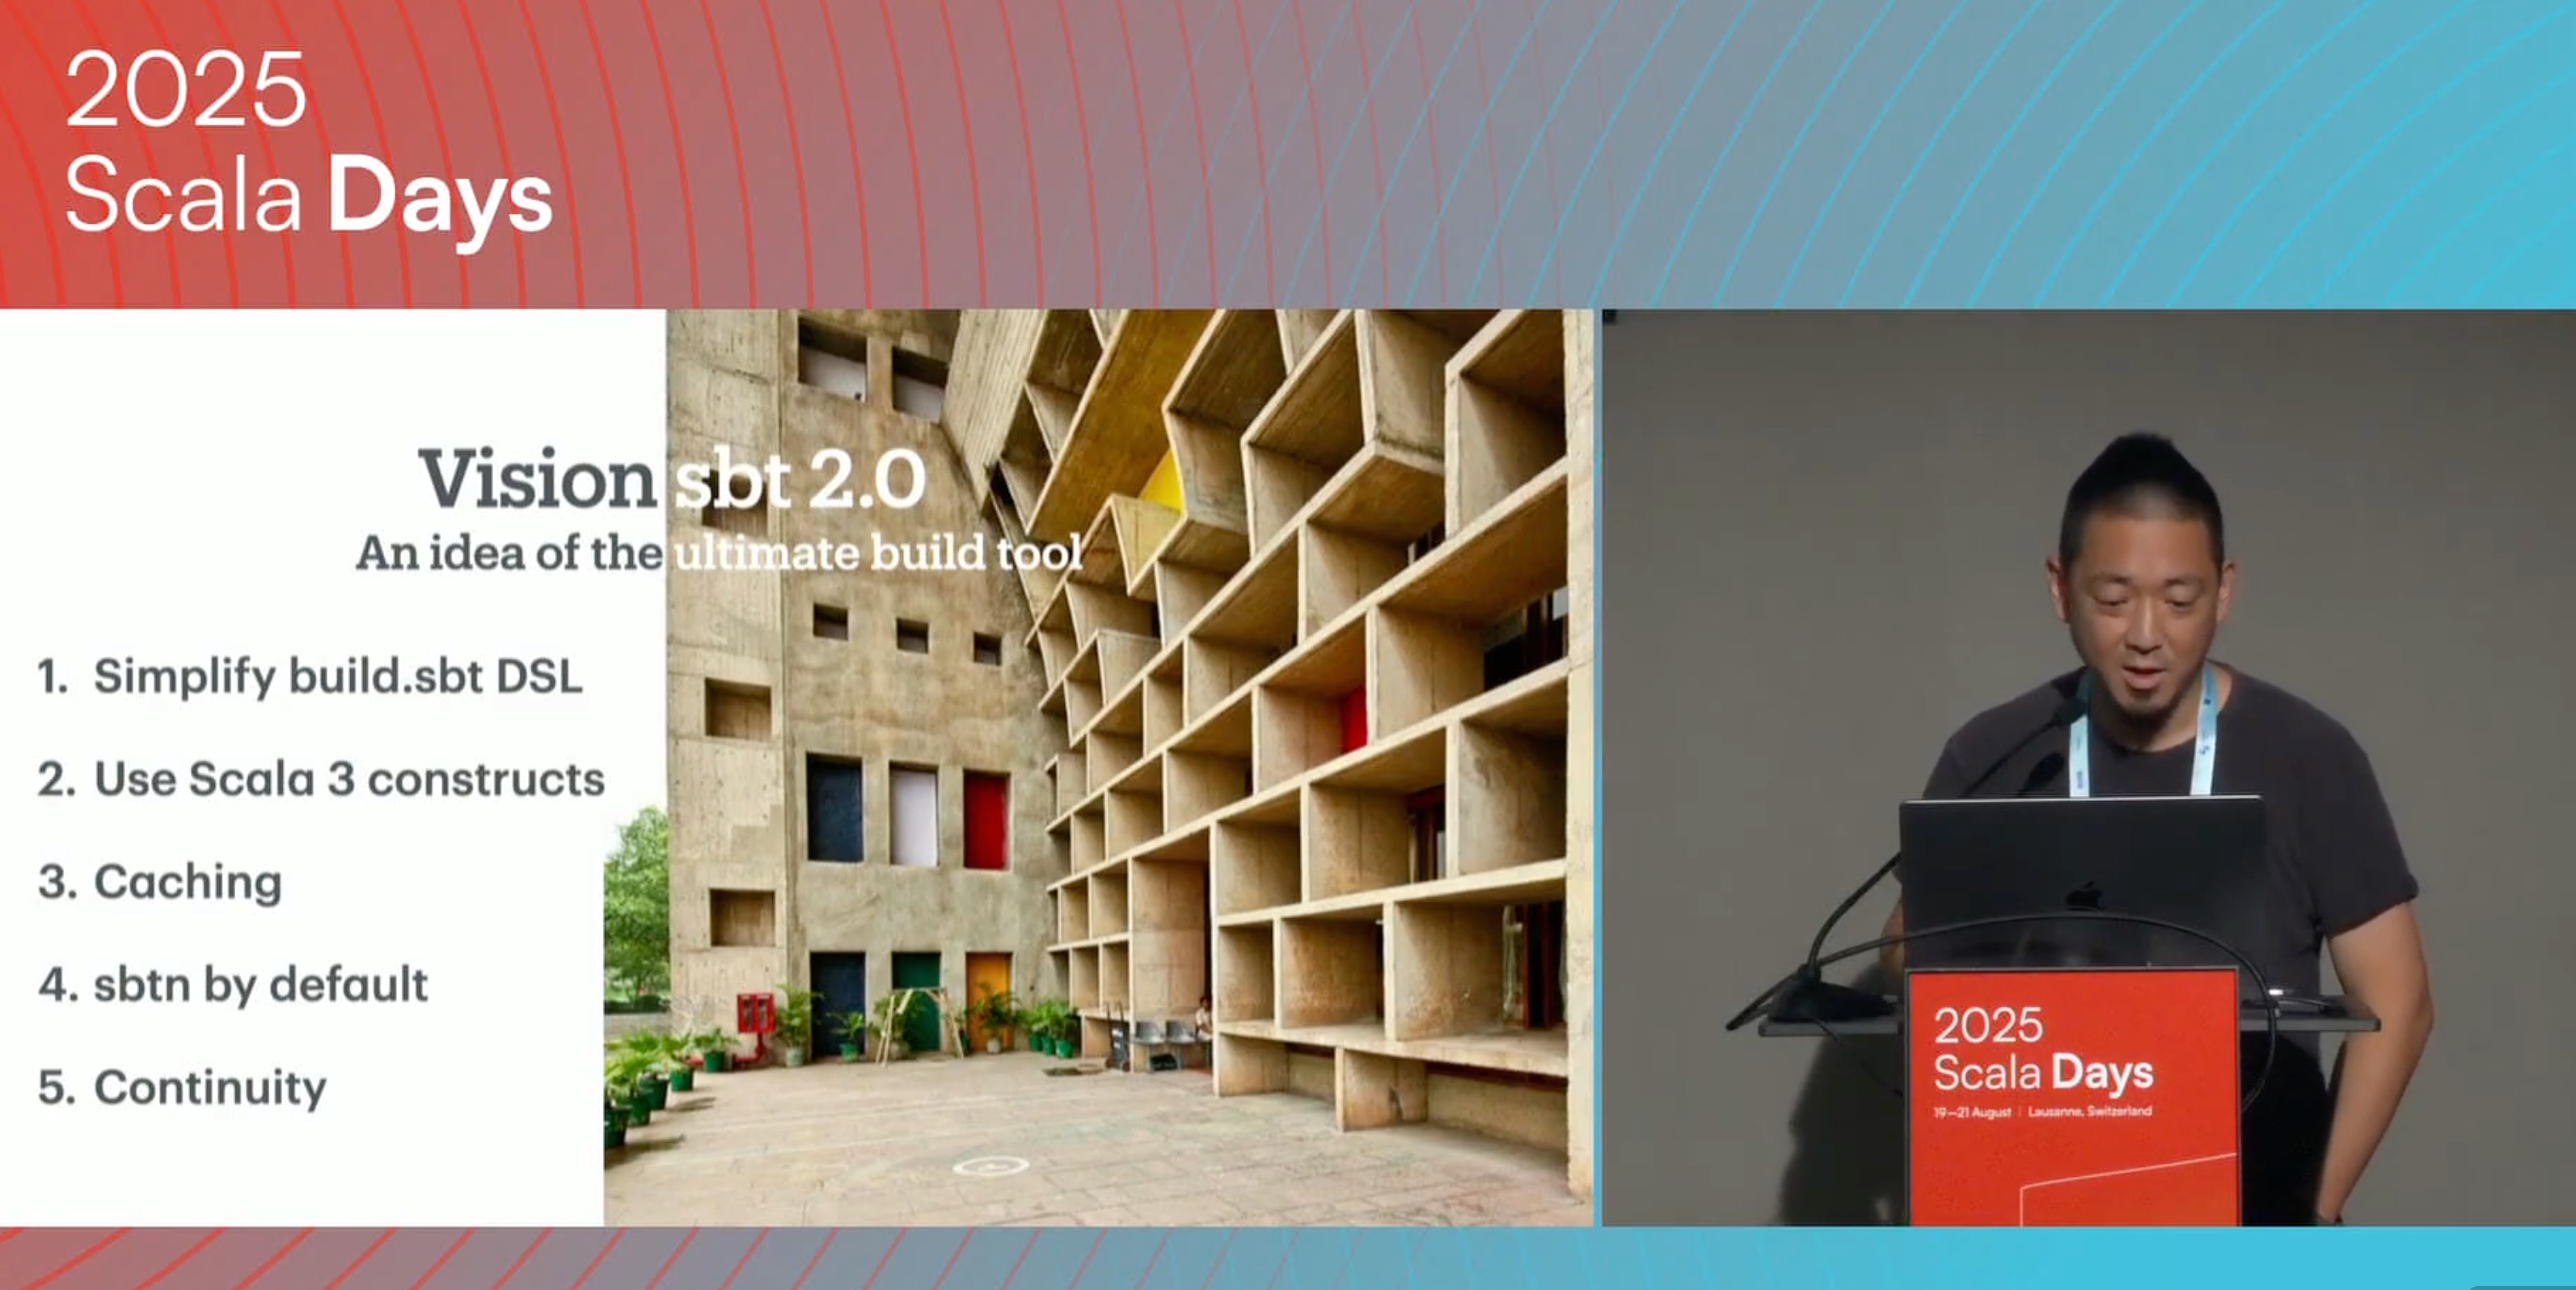
FYI - Scala Days talk recording
I gave a talk ‘sbt 2.0: go big’ during Scala Days 2025, and the recording is available on YouTube. Check it out, and let me know what you think. Here is the slide deck.